Tuesday, October 8, 2013

Charting is easy with JqPlot, LINQ, ASP.NET, C#


This post shows a simple approach to render charts using JQPlot javascript plugin in an ASP.NET page. I have created sample data here but in actual case you could get it from database or a SharePoint list or any other data source. I am using Page.ClientScript.RegisterClientScriptBlock approach to inject the JSON object through client script block and later using JQuery document ready event to read the JSON object. The other approach could be making an Ajax call to the server side method [WebMethod] and directly fetch the data. It's up to the requirement.

Download the JQPlot here. It's free.
Assuming we already have an ASPX page in ASP.NET web application. 


Code-behind (cs)

1 using System; 2 using System.Collections.Generic; 3 using System.Linq; 4 using System.Web; 5 using System.Web.UI; 6 using System.Web.UI.WebControls; 7 using System.Web.Script; 8 using System.Web.Script.Serialization; 9 10 public partial class jqplots : System.Web.UI.Page 11 { 12 protected void Page_Load(object sender, EventArgs e) 13 { 14 if (!Page.IsPostBack) 15 { 16 //collect the data 17 List<Issue> listIssues = new List<Issue>(); 18 listIssues.Add(new Issue() { Title = "Page loads very slow", Priority = "Medium" }); 19 listIssues.Add(new Issue() { Title = "Page validation error", Priority = "High" }); 20 listIssues.Add(new Issue() { Title = "Date format showing 12:00:00 AM", Priority = "Low" }); 21 listIssues.Add(new Issue() { Title = "Table borders", Priority = "Low" }); 22 listIssues.Add(new Issue() { Title = "Some values not saving", Priority = "Low" }); 23 24 //LINQ Group by 25 var ipCounts = from i in listIssues 26 group i by i.Priority into g 27 select new { Category = g.Key, Value = g.Count() }; 28 29 //Anonymous type 30 var ip = new { issuePriority = ipCounts.ToList() }; 31 32 string issuePriorityTotals = "var issueTotals = " + new JavaScriptSerializer().Serialize(ip) + ";"; 33 34 //render javascript block to access the object from JQuery document ready function 35 Page.ClientScript.RegisterClientScriptBlock(this.GetType(), "IP", issuePriorityTotals, true); 36 } 37 } 38 39 [Serializable] 40 public class Issue 41 { 42 public string Title { get; set; } 43 public string Priority { get; set; } 44 } 45 }

Page ViewSource (don't copy this)
If you check the browser view source after the page loads, you should see the script block like the one below. The JSON object issueTotals is the key here. You will have to read the object and construct an array and then use it JqPlot chart method. See the JavaScript code in HTML source in the next section. 

1 <script type="text/javascript">
2 //<![CDATA[
3 var issueTotals = {"issuePriority":[{"Category":"Medium","Value":1},{"Category":"High","Value":1},{"Category":"Low","Value":3}]};//]]>
4 </script>

HTML Source (aspx)


  • Print
  •  
  • About BlogTrog Code Window
 1 <%@ Page Language="C#" AutoEventWireup="true" CodeFile="jqplots.aspx.cs" Inherits="jqplots" %>
 2 
 3 <!DOCTYPE html PUBLIC "-//W3C//DTD XHTML 1.0 Transitional//EN" "http://www.w3.org/TR/xhtml1/DTD/xhtml1-transitional.dtd">
 4 
 5 <html xmlns="http://www.w3.org/1999/xhtml">
 6 <head runat="server">
 7     <title>JQPlot Demo</title>
 8     <script src="Scripts/common/jquery.min.js" type="text/javascript"></script>
 9     <script src="Scripts/jqplot/jquery.jqplot.min.js" type="text/javascript"></script>
10     <script src="Scripts/jqplot/jqplot.canvasTextRenderer.min.js" type="text/javascript"></script>
11     <script src="Scripts/jqplot/jqplot.canvasAxisTickRenderer.min.js" type="text/javascript"></script>
12     <script src="Scripts/jqplot/jqplot.categoryAxisRenderer.min.js" type="text/javascript"></script>
13     <script src="Scripts/jqplot/jqplot.pointLabels.min.js" type="text/javascript"></script>
14     <script src="Scripts/jqplot/jqplot.barRenderer.min.js" type="text/javascript"></script>
15     <script src="Scripts/jqplot/jqplot.pieRenderer.min.js" type="text/javascript"></script>
16     <link href="Scripts/jqplot/jquery.jqplot.min.css" rel="stylesheet" type="text/css" />
17 
18 
19     <script type="text/javascript">
20         $(document).ready(function () {
21             var data = [];            
22             if (issueTotals) {
23                 if (typeof issueTotals.issuePriority != "undefined") {
24                     var obj = issueTotals.issuePriority;
25                     for (var i = 0; i < obj.length; i++) {
26                         data.push([obj[i].Category, obj[i].Value]);
27                     }
28                 }
29             }
30 
31             $('#chart1').jqplot([data], {
32                 title: 'Issue Priority Totals - Bar chart',
33                 // Provide a custom seriesColors array to override the default colors.
34                 seriesColors: ['#85802b', '#00749F', '#73C774', '#C7754C', '#17BDB8'],
35                 seriesDefaults: {
36                     renderer: $.jqplot.BarRenderer,
37                     rendererOptions: {
38                         // Set varyBarColor to true to use the custom colors on the bars.
39                         varyBarColor: true,
40                         barWidth: 60,
41                         barMargin: 5
42                     }
43                 },
44                 axesDefaults: {
45                     tickOptions: { formatString: '%d' }
46                 },
47                 axes: {
48                     xaxis: {
49                         renderer: $.jqplot.CategoryAxisRenderer
50                     }
51                 }
52             });
53 
54             $.jqplot('chart2', [data], {
55                 grid: {
56                     drawBorder: true,
57                     drawGridlines: false,
58                     background: '#ffffff',
59                     shadow: false
60                 },
61                 title: 'Issue Priority Totals - Pie chart',
62                 axesDefaults: {
63 
64             },
65             seriesDefaults: {
66                 renderer: $.jqplot.PieRenderer,
67                 rendererOptions: {
68                     showDataLabels: true
69                 }
70             },
71             legend: {
72                 show: true,
73                 rendererOptions: {
74                     numberRows: 2
75                 },
76                 location: 's'
77             }
78         });
79 
80         });
81     </script>  
82     
83 </head>
84 <body>
85     <form id="form1" runat="server">
86     <div>
87         <div id="chart1" style="margin-top:20px; margin-left:20px; width:400px; height:400px; float:left; margin-right:10px;"></div>
88         <div id="chart2" style="margin-top:20px; margin-left:20px; width:400px; height:400px; float:left"></div>        
89     </div>   
90     </form>
91 </body>
92 </html>


Output


References


Thursday, October 3, 2013

Load SSRS report using JavaScript


Scenario: 

My client wanted me to show SSRS report on a sharepoint (2010) content page which has Start Date and End Date Ribbon controls. Goal is to capture Start and End date values from the ribbon and passed as SSRS report and load the report dynamically on the page. Users shouldn't see the report parameter pane or header pane of when the report renders.

ribbon menu controls start date and end date

Assumptions:


  1. SQL reporting services 2008 is installed in SharePoint integrated mode.
  2. SSRS report is already developed and uploaded to the Document library. The Report takes two input parameters Start Date and End Date
  3. SharePoint content page has Start Date and End Date ribbon controls 


Approach: 

Use Content editor webpart (CEWP) and place javascript inside the webpart to manipulate the DOM and load the SSRS report in an IFrame.

SSRS URL parameter reference

Steps:


  1. As preliminary step, create a text file and copy the JavaScript and HTML source provided below.
  2. Modify the JavaScript source to replace the SSRS report URLs per your SharePoint environment ** (this is an important step otherwise code will not work). Make sure your 
  3. Upload the textfile created above to a document library. Library must at least have read access to the user who visit the page to see the report. (It's better to assign read access to NT Authority\authenticated users group).
  4. Copy the shortcut of the text file (full URL) from the library
  5. Open the SharePoint content page where we supposed to the Webpart. Edit the page.
  6. Add Content Editor Webpart (CEWP) to the page.
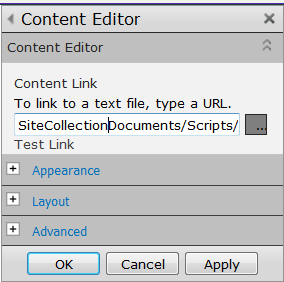
  7. Edit the CEWP and Paste shortcut into the Content Link (see the screenshot below). Click OK. 
  8. That should load the report!!


Copy the Javascript and HTML source to place in Content Editor Webpart. You need to modify the highlighted lines to suit your environment. RSViewerPage.aspx is the key in loading the SSRS report. Make sure you have it in the URL.

     
  • Print
  •  
  • About BlogTrog Code Window
 1 <script type="text/javascript">
 2 
 3 function ShowReport(){
 4 
 5     var startDateValue = "";
 6     var endDateValue = "";
 7             
 8     
 9 
10     //find all html input controls
11     var ctl_dtInput = document.getElementsByTagName('input');
12        
13     //Read the SharePoint Ribbon Start Date and End Date values
14     for(var i=0; i<ctl_dtInput.length; i++)
15        {
16             if (ctl_dtInput[i].id.indexOf('Date')>0){
17                 if (ctl_dtInput[i].id == 'Ribbon.ContextualTabs.TaskUpdates.Home.DateRange.FromDate')
18                     startDateValue = ctl_dtInput[i].value;
19                 if (ctl_dtInput[i].id == 'Ribbon.ContextualTabs.TaskUpdates.Home.DateRange.ToDate')
20                     endDateValue = ctl_dtInput[i].value;
21                 }
22             if(startDateValue!="" && endDateValue!="") break;
23         }
24                
25     //if either start date or end date missing
26      if(startDateValue=="" || endDateValue==""){
27         alert("Either start date or end date is missing. Report cannot be loaded....");
28         return;
29     }
30 
31     //********************************************************************
32     // SSRS Report expects 2 parameters
33     // <param name="StartDate" />
34     // <param name="EndDate" />    
35     //For example the URL should be constructed in this format//  http://hostname/PWA/ProjectBICenter/_layouts/ReportServer/RSViewerPage.aspx?rs:Command=Render&rv:ToolBar=None&rv:ParamMode=Collapsed&rv:HeaderArea=None&DefaultItemOpen=1&&rv:RelativeReportUrl=/PWA/ProjectBICenter/SSRSReports/PendingApprovals.rdl&Source=http://hostname/pwa/ProjectBICenter/SSRSReports/Forms/AllItems.aspx&rp:StartDate=9/1/2013&rp:EndDate=9/1/2013
36     //********************************************************************
37 
38     //Modify these Urls per your environment
39     //*********************************************************************
40     var rptRelUrl = "/PWA/ProjectBICenter/SSRSReports/PendingApprovals.rdl";
41     var rptDocumentLibraryAbsUrl = "http://hostname/pwa/ProjectBICenter/SSRSReports/Forms/AllItems.aspx";
42     //*********************************************************************
43     
44     //******************** modify this url according to your environment ***************************
45     var rptViewerUrl = "http://hostname/PWA/ProjectBICenter/_layouts/ReportServer/RSViewerPage.aspx?rs:Command=Render&rv:ToolBar=None&rv:ParamMode=Collapsed&rv:HeaderArea=None&DefaultItemOpen=1";
46     //******************** modify this url according to your environment ***************************
47     var rptFullUrl = rptViewerUrl.concat("&rv:RelativeReportUrl=",rptRelUrl,"&Source=",rptDocumentLibraryAbsUrl,"&rp:StartDate=",startDateValue,"&rp:EndDate=",endDateValue);
48 
49      //find the container DIV
50      var rptContainer = document.getElementById('rptContainerDiv');
51 
52      //clear all the child nodes in the container before adding any new child nodes
53      if (rptContainer){
54        var allNodes = rptContainer.childNodes;
55        if (allNodes.length>0){
56         for(var i=0; i<allNodes.length; i++)
57           rptContainer.removeChild(allNodes[i]);
58        }
59        //set up width and height
60        rptContainer.style.width = 100+"%";
61        rptContainer.style.height = 600+"px";         
62 
63        //build iframe that houses the report viewer
64        var rptFrame = document.createElement("IFRAME");
65        rptFrame.setAttribute("src", rptFullUrl);
66        rptFrame.style.width = 100+"%";
67        rptFrame.style.height = 100+"%";
68 
69        //add the report IFrame to DIV container   
70        rptContainer.appendChild(rptFrame);
71 
72     }
73 }
74 
75 </script>
76 
77 <div id="rptContainerDiv">
78 <a style="font-weight:bold; font-size:14px" onclick="ShowReport(); return false;">Click to view the Report</a>
79 </div>

Wednesday, October 2, 2013

Global javascript variables on PWA pages


Global variable user NT Account on Project Server PWA pages


On all Project server PWA site pages (but not in custom application pages from _layouts), go to ViewSource, you will find client script block rendered in the HTML DOM. See the highlighted to javascript variable.

1 <SCRIPT type='text/javascript'> 2 var g_sProtocol = 'http:'; 3 var g_fIsRTL = false; 4 var g_fIsNTLogon = 1; 5 var g_sUserName = PJUnescape('domain%5Cjohndoe'); 6 var g_fSuppressWCAlert = false; 7 var g_nSimpleUI = 0; 8 var g_nPageLCID = 1033; 9 var g_PageCulture = 'en-US'; 10 </SCRIPT>

So if you have any JavaScript code through Content Editor webpart, the variable g_sUserName is readily available for use in the code. You may need to use inbuilt JavaScript function escape(g_sUserName) to get the actual string out.